Poisson Distributions
When you want to determine the likelihood that something will happen a certain number of times within the frame of some context, the Poisson distribution is a good option.
For example, suppose an editor knows that on average, there are 3 grammatical errors per page. What's the probability of there being 2 grammatical errors per page? What's the probability of there being 1, 2, or 3 grammatical errors per page?
Or suppose you know a web server gets 25 requests per second. What's the probability that it will get 0 requests? What's the probability that it will get between 10 and 15 requests?
These questions and more can be answered by the Poisson distribution.
We can use when:
The number of successes in two disjoint time intervals is independent.
The probability of a success during a small time interval is proportional to the entire length of the time interval.
The probability mass function is given by,
\[ f(k; \lambda) = \frac{\lambda^k e^{-\lambda}}{k!} \]where \(\lambda\) is the mean value of whatever per unit whatever time.
It's just a lot easier to use Julia's Distributions package.
The global populations increases by approximately three people every second.
using Distributions, StatsPlots, StatsBase

d = Poisson(3)
plot(d)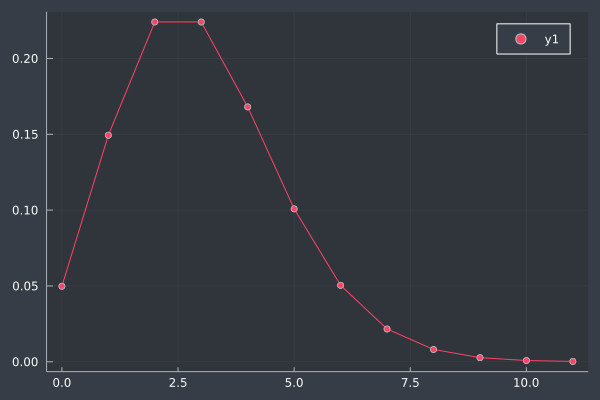
Given that we know the average birthrate is three people each second, what's the probability that exactly four people will be born each second?
@show pdf(d, 4)
> pdf(d, 4) = 0.16803135574154093
What's the probability that 0, 1, 2, 3, or 4 people will be born each second?
reduce((iter, k) -> iter + pdf(d, k), 0:4)
> 0.7654761761559083