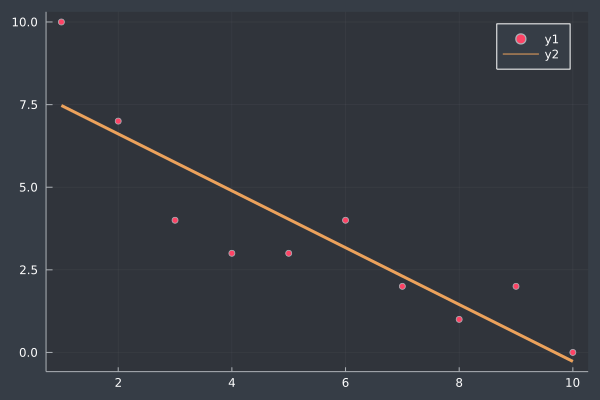
Finding a Trend Line with Least Squares
Suppose we have a bunch of data points in \(\mathbf{y}\). We create a design matrix, \(X\) which consists of the pattern that we want to match. The first column will be all \(1\)'s because that's the constant term. The second column will be the numbers \(1\) through \(N\) for the linear term. If we wanted a quadratic term, we could include an \(x^2\) sequence as a third column or for a cubic term a \(x^3\) sequence as a fourth column.
\[X = \begin{bmatrix}1 & 1 \\ 1 & 2 \\ 1 & 3 \\ \vdots & \vdots \\ 1 & N \end{bmatrix}\]To determine the trendline, we need to solve the equation,
\[ X \mathbf{b} = \mathbf{y} \,.\]Assuming \(X\) is non-invertible,
\[\begin{aligned} X^\top X \mathbf{b} &= X^\top \mathbf{y} \\ (X^\top X)^{-1} (X^\top X) \mathbf{b} &= (X^\top X)^{-1} X^\top \mathbf{y} \\ \mathbb{1}\cdot\mathbf{b} &= (X^\top X)^{-1} X^\top \mathbf{y} \\ \mathbf{b} &= (X^\top X)^{-1} X^\top \mathbf{y} \\ \end{aligned}\]using Plots
y = [10.0, 7.0, 4.0, 3.0, 3.0, 4.0, 2.0, 1.0, 2.0, 0.0]
X = [ ones(10) 1:10 ]
b = inv(X'*X)*X'*y
scatter(y)
plot!(X * b, lw=3)
© Daniel Marvin. Last modified: August 02, 2021.