Centroids
The centroid is the arithmetic mean position of all the points of a geometric object. Suppose we have some bounded region of space, then the centroid is simply the geometric center of the object. More commonly we'll have a region of space with some associated mass function and the centroid is the point of equilibrium where the mass balances out, an example from physics being the center of mass or center of gravity of a body. However, it has a ton of other applications and interpretations and offers a great deal of value in many disciplines.
Rather than writing custom numerical methods to handle the discrete calculus and other computations, we'll use the SymPy package for both finding roots and integrating. Then we'll use the Plots and LaTeXStrings packages for visual representations.
Center of Mass Example with Region from Single Function
using Plots, SymPy, LaTeXStrings

y(x) = 2*sin(2*x)
X = 0:0.01:(π/2) |> collect
Y = y.(x)
p = plot(X, Y, fillalpha=0.2,
         c =:orange, fill=true,
         label=L"2\sin(2x)")

@vars x
area = integrate(2*sin(2*x), 0, π/2)
moment_x_fn = 1/area * 2 * sin(2*x)^2
moment_x = integrate(moment_x_fn, 0, π/2)
moment_y_fn = 1/area * 2 * x * sin(2*x)
moment_y = integrate(moment_y_fn, 0, π/2)

xbar, ybar = N(moment_y), N(moment_x)

scatter!([xbar], [ybar], lw=5, label="Center of Mass")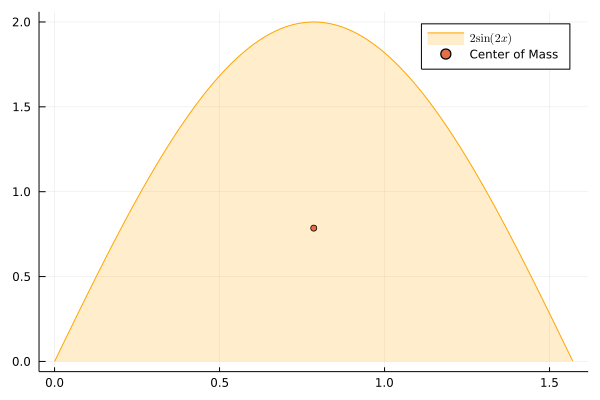
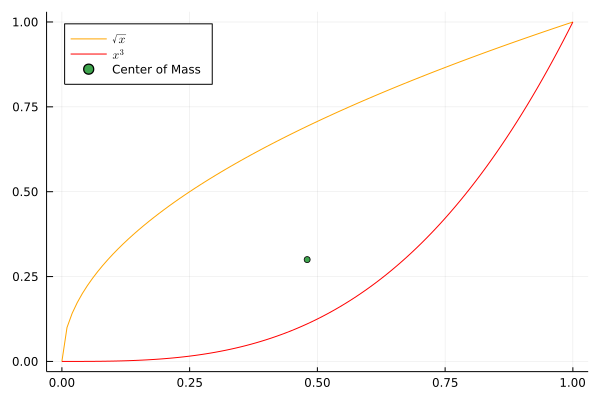
Center of Mass Example with Region from Two Curves
using Plots, SymPy, LaTeXStrings

@vars x

# find centroid of region bounded by x^3 and √x
curve1(x) = x^3
curve2(x) = sqrt(x)

# solve eqn to determine interval
eqn = Eq(curve1(x) - curve2(x), 0)
sol = solve(eqn, x)

X = 0:0.01:1 |> collect
Y1 = curve1.(X)
Y2 = curve2.(X)

plot(X, Y2, fillalpha=0.2, c=:orange, label=L"\sqrt{x}")
plot!(X, Y1, fillalpha=1.0, c=:red, label=L"x^3", legend=:topleft)

area = integrate(curve2(x) - curve1(x), 0, 1)
moment_x_fn = 1/area * 1/2 * ( curve2(x)^2 - curve1(x)^1 )
moment_x = integrate(moment_x_fn, 0, 1)

moment_y_fn = 1/area * x * (curve2(x) - curve1(x))
moment_y = integrate(moment_y_fn, 0, 1)

xbar, ybar = N(moment_y), N(moment_x)

scatter!([xbar], [ybar], lw=5, label="Center of Mass")