Web Scraping and Data Visualization
In this post, we're going to scrape a website to pull the Gallup poll results from a question, "In politics, as of today, do you consider yourself a Republican, a Democrat or an independent?"
The approach is as follows,
Retrieve the web page using
HTTP.Use
Gumboto parse the body of the page.Use
CascadiaandGumboto select and parse individual data in the page.Organize the data using
DataFrames.Write the data to disk using
DataFramesandCSV.Visualize the data using
Plots
Initially, we'll need to include our desired packages and libraries and I'll set some initial configuration values.
using HTTP, Cascadia, Gumbo
using DataFrames, CSV
using Dates, Plots, PlotThemes
using StatsBase, StatsPlots

gr();
theme(:gruvbox_light)
To help with keeping the code clean and concise, I've written a couple of helper functions. Also, I'm thinking that this could be a good framework for other pages I want to scrape and store, so I created a small array of tuples which will house some data points. I might move sources to a DataFrame and write it to disk as CSV so I could potentially store a larger set of pages.
# Helper Functions
function parsedate(dt)
    rng = findfirst("-", dt)
    dt = isnothing(rng) ? dt : dt[1:rng.start-1]
    Date(dt, "yyyy u dd")
end

function trendline(y)
    ylen = length(y)
    X = [ ones(ylen) 1:ylen ]
    β = inv(X'*X)*X'*y
    return (X, β)
end

# Data
sources = [
 (description = "Gallup Polling for Party Affiliation",
  url = "https://news.gallup.com/poll/15370/party-affiliation.aspx",
  csv = "/local/usr/webscrap_data/vote-registration.csv"),
];
I've written a custom driver function for scraping the Gallup page. Since every page that I'll scrape will need a custom driver function, it would probably make sense to add another value to each sources tuple which would include maybe a file and the name of the function so I can keep them all organized.
To write this driver function, I just manually loaded the page and inspected the source. I found the data I wanted was on the page and identified the tags that wrapped it. Any driver function is going to be unique to the page being scraped. I might try and generalize some parts of it, but the majority is going to be custom.
function scrape_gallup_partyaffil(source)
res = HTTP.get(source.url);
body = String(res.body);
html = parsehtml(body);
# Date, Republicans (%), Independents (%), Democrats (%)
df = DataFrame(
Date = Date[],
Republican = Float64[],
Independent = Float64[],
Democrat = Float64[])
for (k, row) in enumerate(
eachmatch(sel".table-overflow tr", html.root))
try
vals = (
parsedate(string(text(row[1]))),
parse(Float64, text(row[2]))/100,
parse(Float64, text(row[3]))/100,
parse(Float64, text(row[4]))/100
)
push!(df, vals)
catch e
continue
end
end
CSV.write(source.csv, df)
df
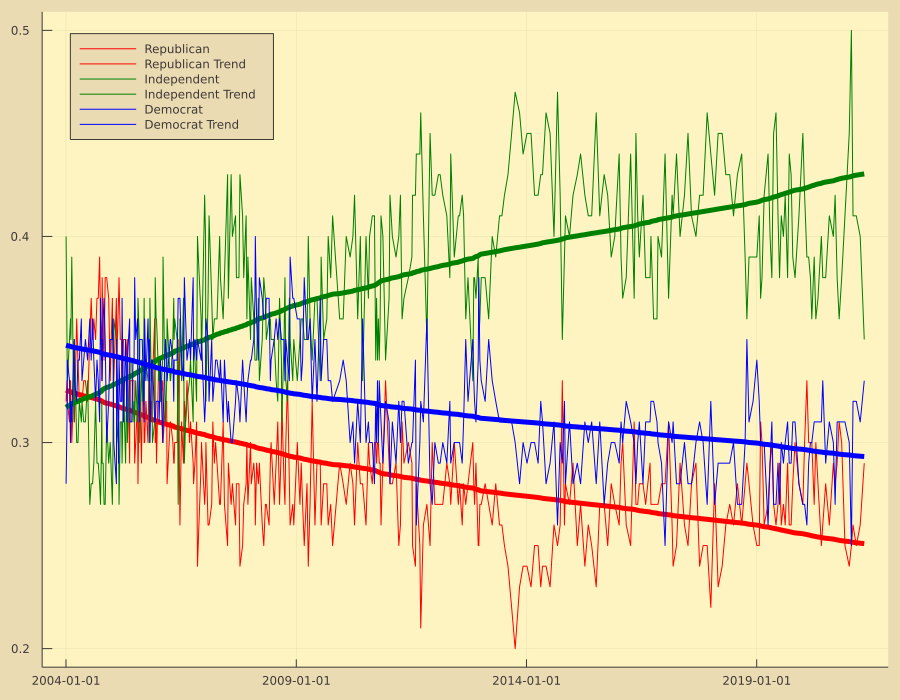
endFinally we put it all together and have some code to call the driver function and populate the DataFrame. Pull the data out to make it easier to work with and then plot it.
df = scrape_gallup_partyaffil(sources[1]);
(dts, rep, ind, dem) = (df[:, 1], df[:, 2], df[:, 3], df[:, 4]);

(X, β1) = trendline(rep)
Plots.plot(dts, rep, label="Republican", c=:red, legend=:topleft, size=(900, 700))
Plots.plot!(dts, X*β1, c=:red, lw=5, label="Republican Trend")

(X, β2) = trendline(ind)
Plots.plot!(dts, ind, label="Independent", c=:green)
Plots.plot!(dts, X*β2, c=:green, lw=5, label="Independent Trend")

(X, β3) = trendline(dem)
Plots.plot!(dts, dem, label="Democrat", c=:blue)
Plots.plot!(dts, X*β3, c=:blue, lw=5, label="Democrat Trend")