Plotting Vectors
When we want to plot vectors using the Plots package, we will need to specify where the vector starts and where it ends. In the case of most Linear Algebra, our vectors will extend from the origin to some \((x, y)\).
This is one of the few aspects of plotting in Julia which I personally find a little irritating to work with, but it's easy enough to simplify it.
Manually, we would write a vector which ranges from the origin to \((1, 2)\) as follows.
plot([0, 1], [0, 2], arrow=true)Notice that for the first argument, we provide two values, \(0\) and \(1\) since in the \(x\)-direction, it will go from \(x = 0\) to \(x = 1\). Additionally we write \(0\) and \(2\) for the \(y\)-direction since it will go from \(y = 0\) to \(y = 2\).
For multiple vectors, we simply need to create an array of arrays. For the vectors \((1, -1)\) and \((2, 5)\), we would write the \(x\) and \(y\) values as such:
X = [[0, 1],[0, 2]]
Y = [[0, -1],[0, 5]]
plot(X, Y, arrow=true)
To simplify collecting vectors and putting them into the necessarily format, we can write a function which will handle this process. I've written a function collectvectors which will take a variable number of arguments, each of which will be a \(2\)-dimensional vector, e.g. collectvectors(u, v).
In words, the function will store the length of vecs, a tuple containing the arguments. This will be used to pre-allocate two arrays to store the \(X\) and \(Y\) components, respectively. Then we iterate over each provided argument, in this case each vector, where we construct each interval ranging from the origin to the provided point. We finally return a tuple of the two arrays.
function collectvectors(vecs...)
ℓ = length(vecs)
X = Array{Vector{Float64}, 1}(undef, ℓ)
Y = Array{Vector{Float64}, 1}(undef, ℓ)
for k in eachindex(vecs)
X[k] = [0, vecs[k][1]]
Y[k] = [0, vecs[k][2]]
end
X, Y
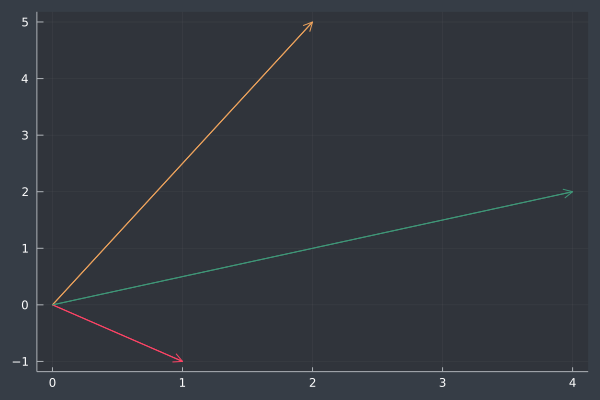
endFor the vectors, \((1, -1)\), \((2, 5)\), and \((4, 2)\), we'll define each of the points first, pass them into the collectvectors function to yield our \(X\) and \(Y\) components, and then pass those into plot to generate our plot.
u = [ 1, -1 ]
v = [ 2,  5 ]
w = [ 4,  2 ]

X, Y = collectvectors(u, v, w)
p = plot(X, Y, arrow=true, label=:none)