Multidimensional Plots in Julia
We will plot the set of points \((x, y, z)\) where \(z : \mathbb{R}\times\mathbb{R} \rightarrow \mathbb{R}\) such that,
\[ z(x, y) = y\cdot\sin{x^3} + x\cdot\cos{y^2} \,.\]z(x, y) = y*sin(x^3)+x*cos(y^2)
plot(-pi:0.01:pi, -1:0.01:1, z, st=:surface, camera=(-30, 15))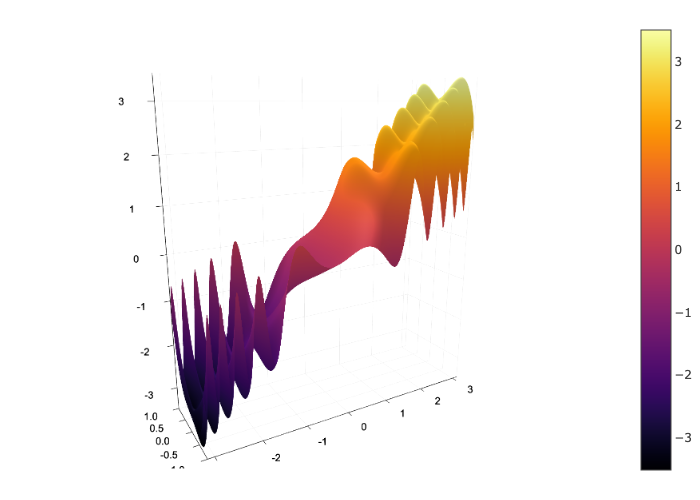
We can also plot the contours for another view of the set.
z(x, y) = y*sin(x^3)+x*cos(y^2)
plot(-1:0.01:1, -1:0.01:1, z, st=:contour)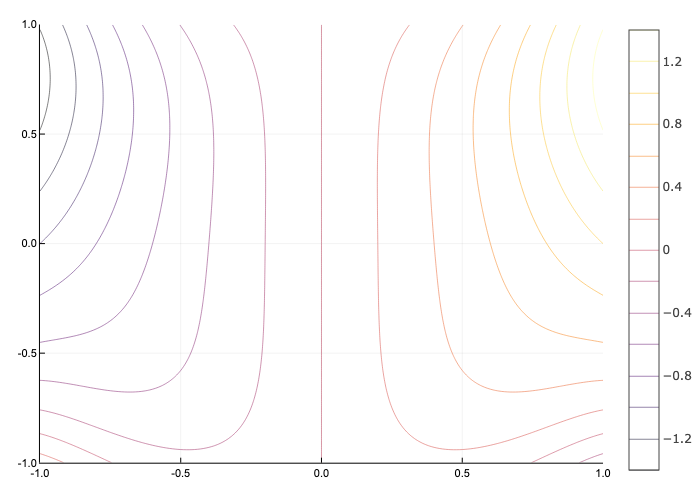
© Daniel Marvin. Last modified: August 02, 2021.